10 Fast-Track Opportunities
for Manufacturing Cost Reduction
Practical Cost Down solutions deployable within 3–6 months based on hands-on industrial projects.

Manufacturing Cost Down is not about crude budget cuts, but about eliminating waste, optimizing resources, and elevating operational agility.
This article synthesizes 10 fast-track Cost Down opportunities deployable within 3–6 months, drawing upon field-tested implementations and the INVAMAX IPO (Input – Process – Output) cost architecture.
1. Rethinking Manufacturing Costs (IPO Framework)
Manufacturing cost encompasses the entire lifecycle from raw material acquisition to final customer delivery. To identify high-ROI opportunities, analyze expenditures across the 3 stages of the IPO framework:
Input
Resource Readiness
- Raw material & parts procurement
- Tooling & indirect equipment costs
- Surplus orders & premature storage
- Inbound freight & material handling
Process
From First Process
to Finished Goods
- Direct & indirect labor costs
- Consumables & utilities (power, air, steam)
- Equipment maintenance & operating costs
- Supervision & production management
- Scrap, rework, downtime, operator waiting
Output
From Warehouse
to Customer Delivery
- Finished goods warehousing & holding
- Packaging & crating materials
- Outbound transport & logistics freight
- Order processing & fulfillment overhead
- Warranty claims, customer returns & penalties
2. Core Principles for Cost-Down Identification
Focus on the 80/20 Rule
Target the 20% of root causes driving 80% of total plant losses.
Prioritize Fast Quick Wins
Select high-impact opportunities executable within 3–6 months.
Measure Quantifiable Impact
Define baseline KPIs and audit before-vs-after financial savings.
Engage Leadership & Teams
Cost Down succeeds only through cross-functional teamwork and GEMBA discipline.
3. 10 Fast-Track Cost Reduction Opportunities
Below are 10 proven cost-reduction opportunities deployable within 3–6 months across diverse manufacturing industries.
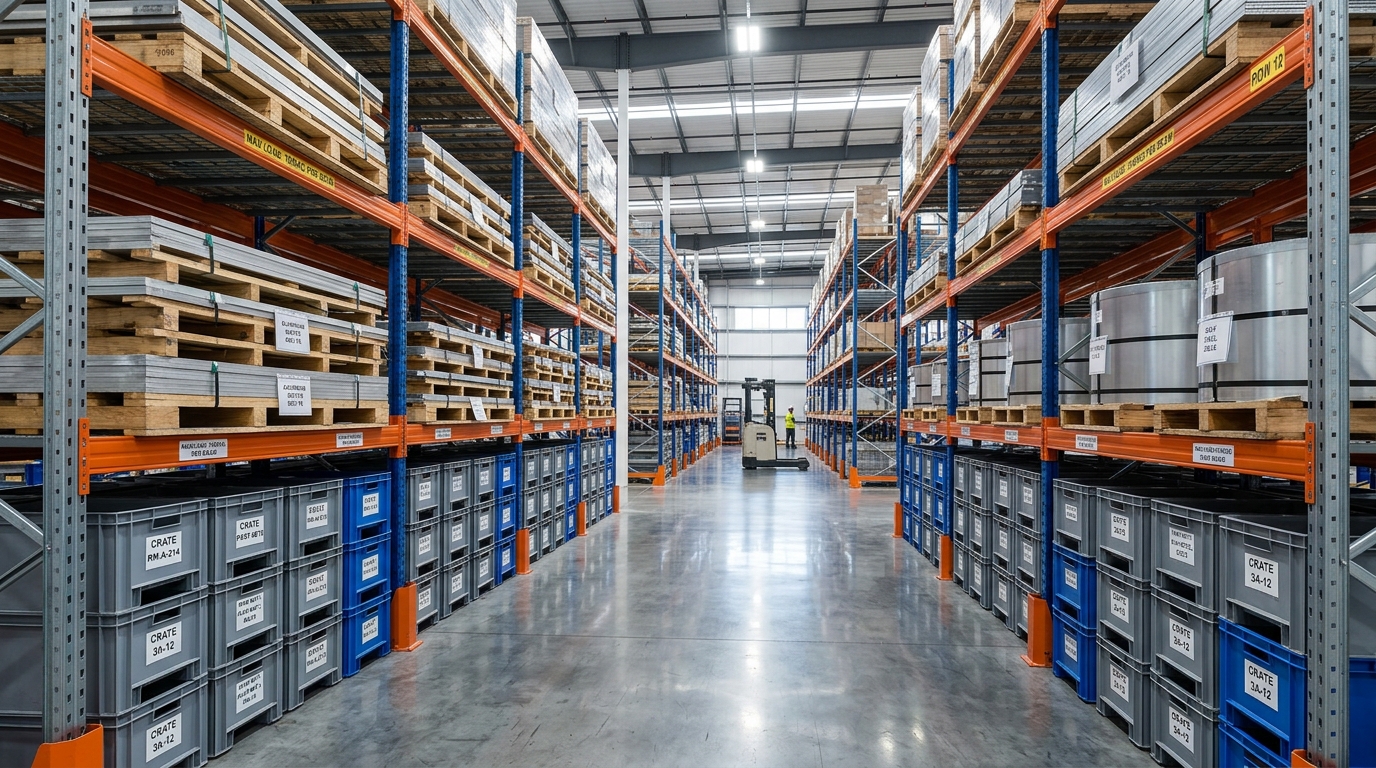
1. Optimize Raw Material Inventory
- Eliminate surplus buys & premature delivery
- Standardize BOM usage tolerances
- Tighten incoming supplier QA inspection
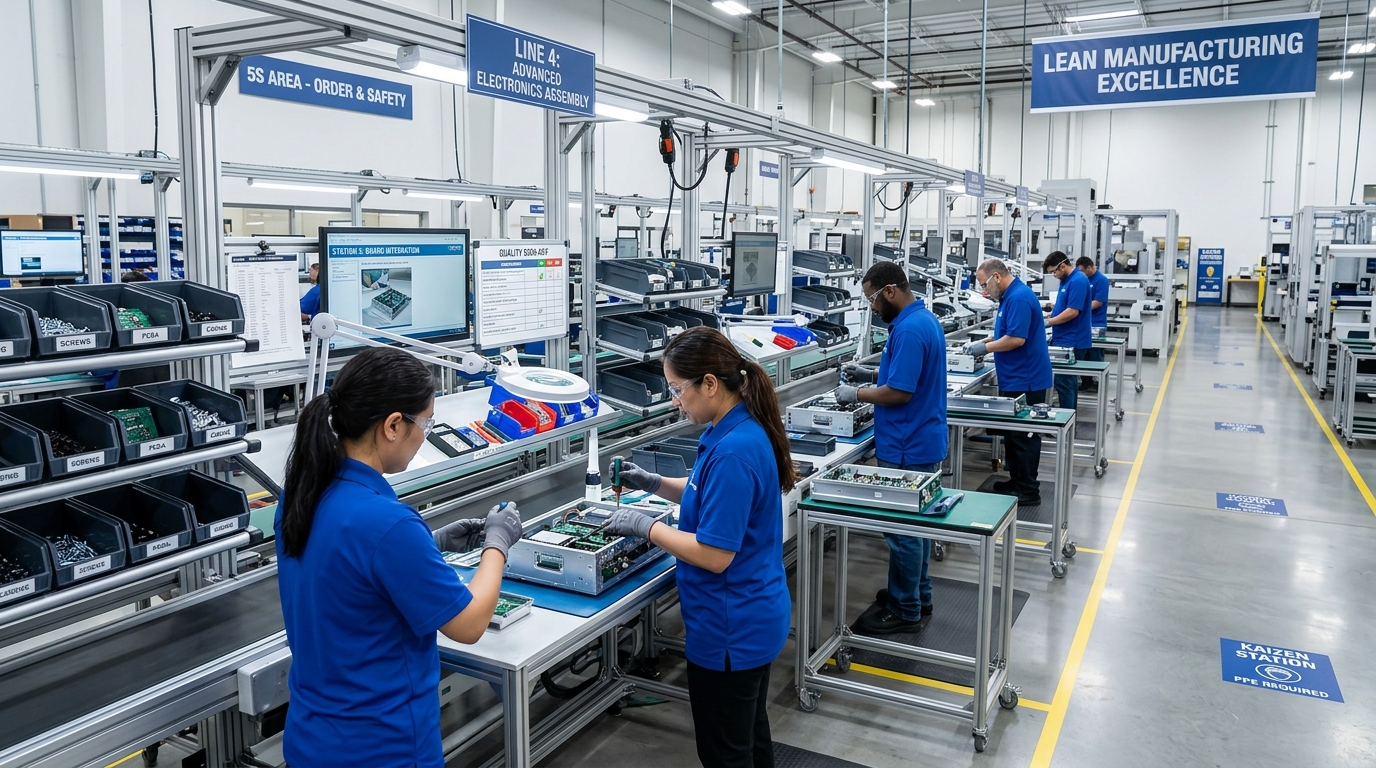
2. Eliminate Shop-Floor Waste
- Eliminate the 7 Lean wastes (Muda)
- Optimize cell layout & line balance
- Minimize waiting and handling transport
Cost Drop: 5–10%
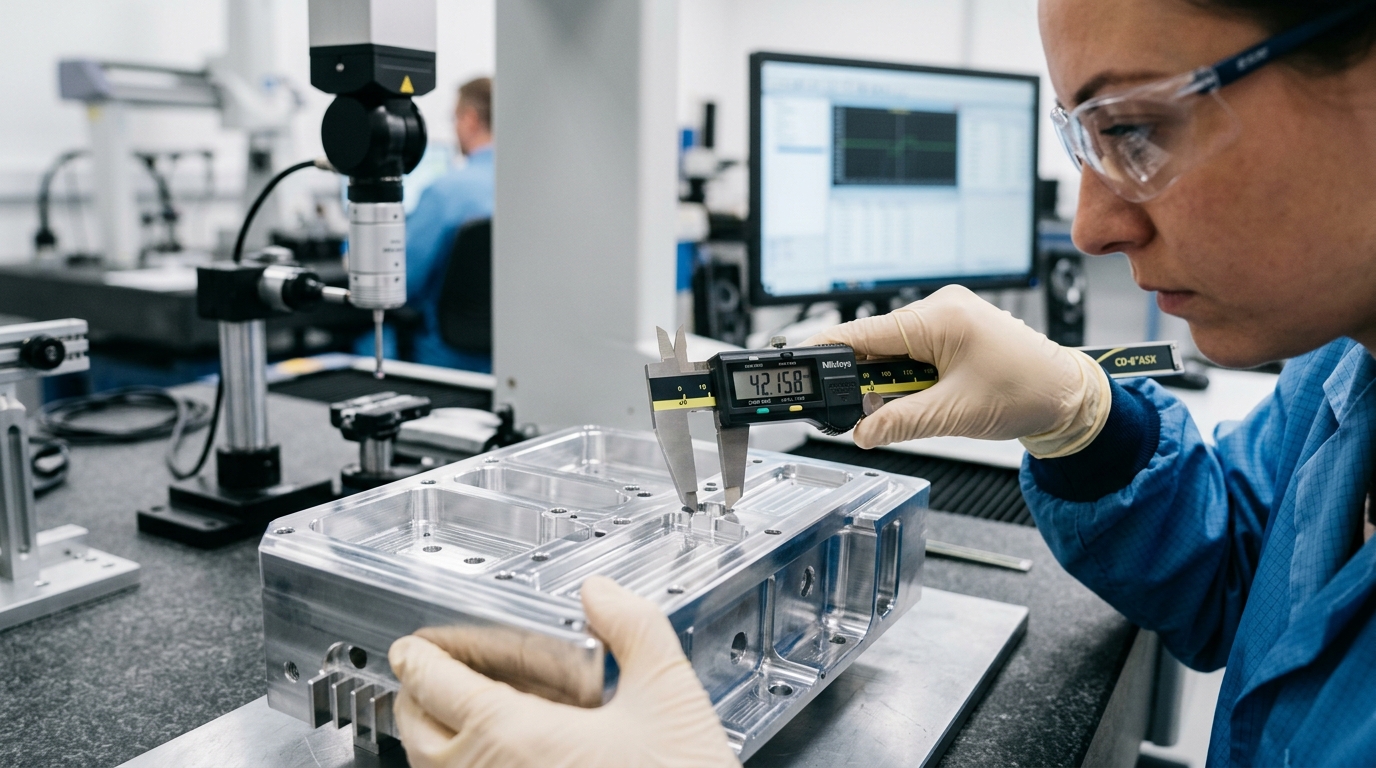
3. Reduce Scrap & Rework
- Root-cause defect Pareto analysis
- Stabilize tooling & process parameters
- Standardize operational work SOPs
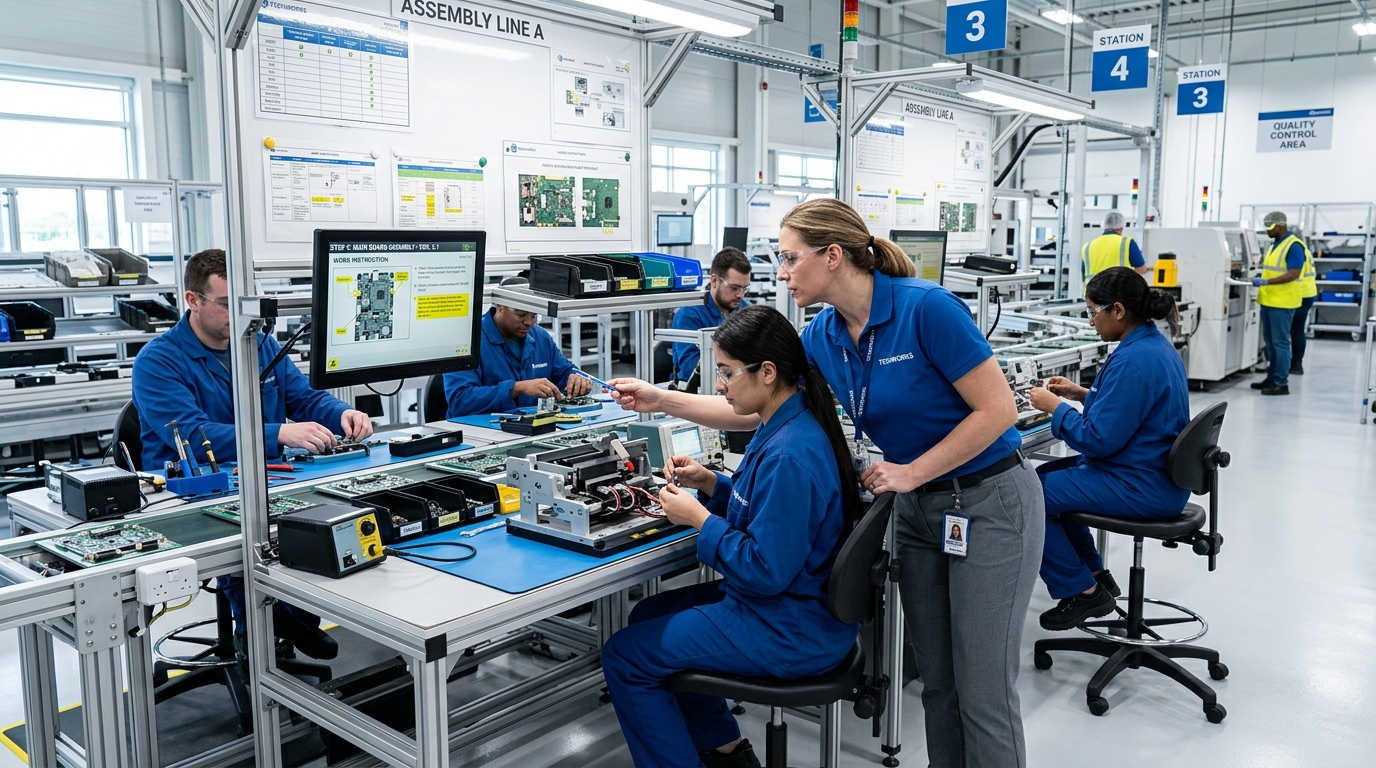
4. Optimize Labor Productivity
- Balance station capacity with takt demand
- Standardize operator motions and SOPs
- Multiskill training & agile staffing
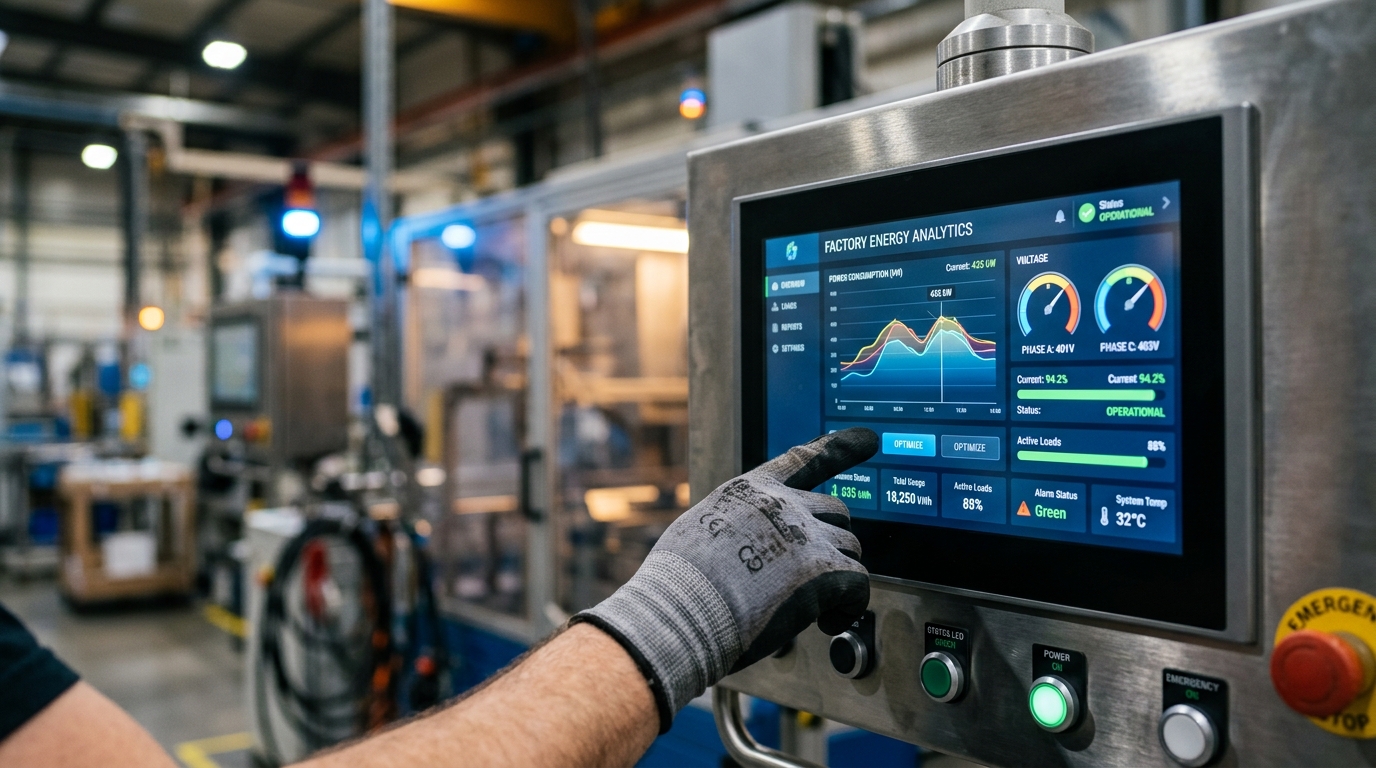
5. Energy & Utility Optimization
- Tune equipment operating parameters
- Preventative maintenance for boilers/chillers
- Eliminate compressed air and steam leaks
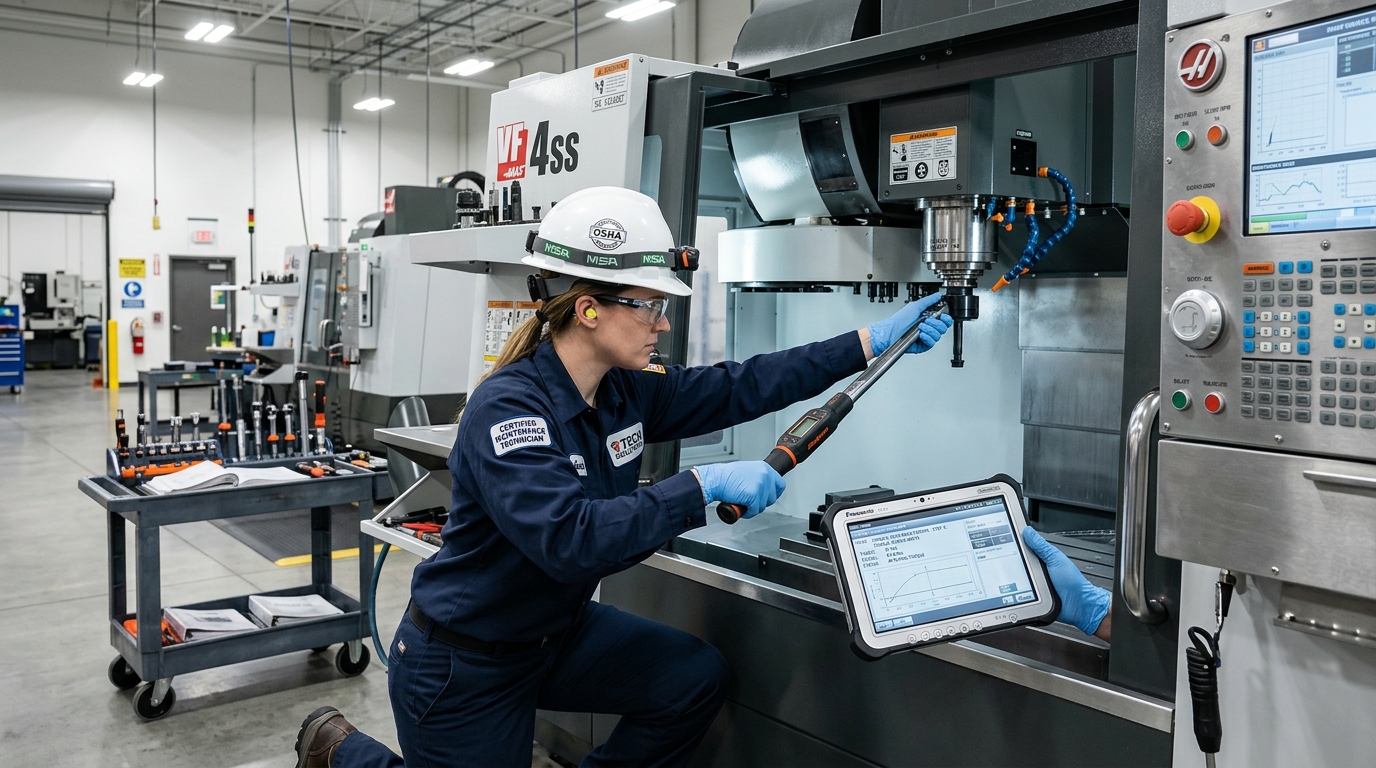
6. Preventative Maintenance & TPM
- Autonomous & planned preventative maintenance
- Rationalize critical spare parts stock
- Extend machine lifespan & lower MTTR
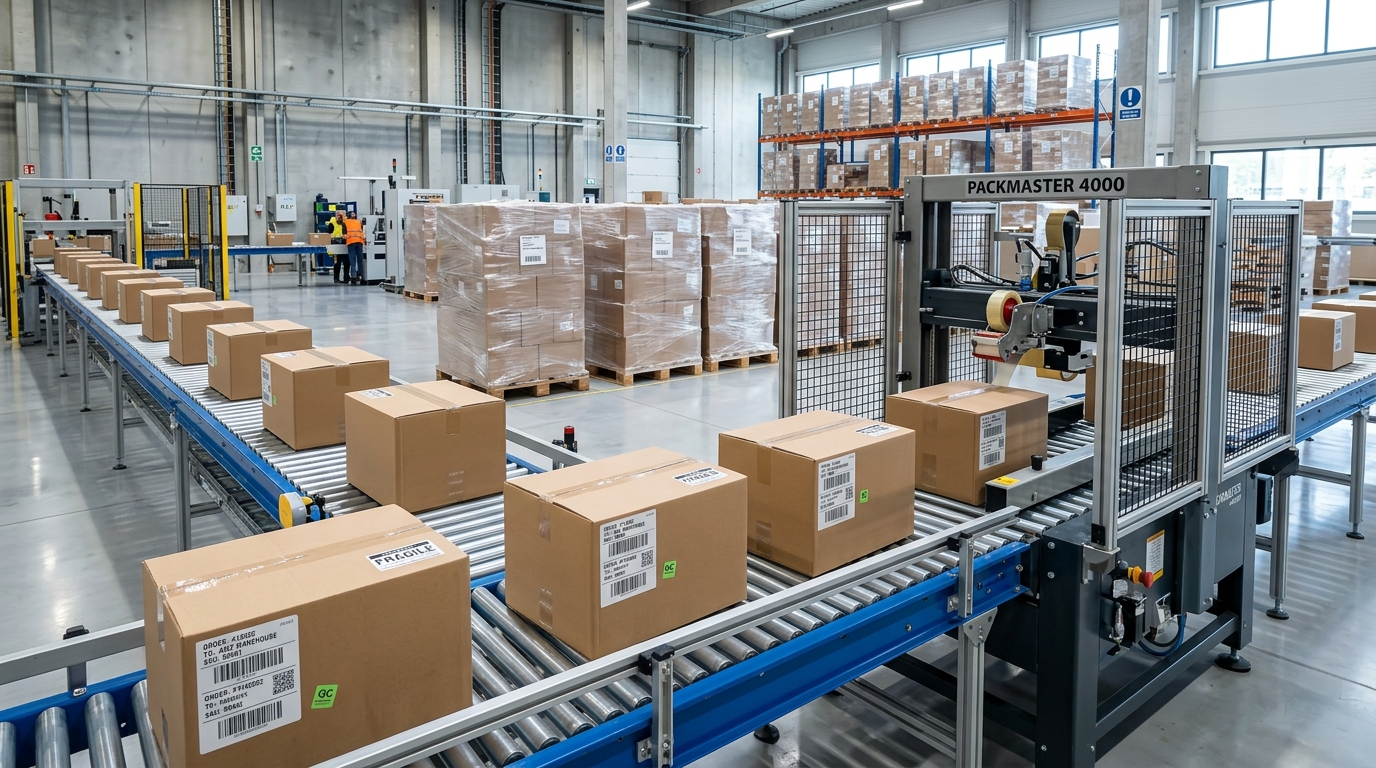
7. Packaging & Packing Optimization
- Cut corrugated box & film material costs
- Standardize pallet & carton dimensions
- Optimize packaging geometry, cut scrap

8. Logistics & Transport Optimization
- Optimize delivery routes and milk runs
- Maximize truck fill rate, cut deadhead runs
- Coordinate delivery schedules with customers

9. Streamline Indirect Overhead
- Audit office expenses & vendor contracts
- Tender and renegotiate third-party suppliers
- Digitize approval workflows and logs

10. Applied Digitalization & AI
- Automate shift and daily production reports
- Real-time telemetry for machine OEE and stops
- Analyze operational data to unlock capacity
4. Case Study: Cost-Down Results After 4 Months
Below is a case study from a precision mechanical factory (8 shop-floor operators, 400 m² footprint).
Cost Structure Before vs. After (IPO Model)
Key Measurable Outcomes
- ↓ Total Manufacturing Cost: -18.5%
- ↓ Raw Material Cost: -12%
- ↓ Labor Cost: -20%
- ↓ Energy Cost: -15%
- ↓ Scrap Defect Rate: -60%
- ↑ Overall Productivity: +25%
- ↓ Order Lead Time: -30%
5. 3–6 Month Implementation Roadmap
Diagnostic Assessment
Map cost structures via IPO and isolate top bottleneck opportunities.
Action Planning
Charter 3–5 actionable initiatives with defined KPI targets.
Execute Improvements
Execute via PDCA cycles with designated cross-functional owners.
Measure Results
Audit before-vs-after metrics and verify audited financial savings.
Standardize & Scale
Institutionalize standard work SOPs and scale across other lines.
6. Key Takeaways & Immediate Action Checklist
Manufacturing cost reduction is an enduring operational journey. While these 10 opportunities do not replace deep diagnostic audits on the GEMBA floor, they empower leaders to start immediately and unlock visible results in 3–6 months.
Start with practical, measurable opportunities that create immediate cash and operational value.